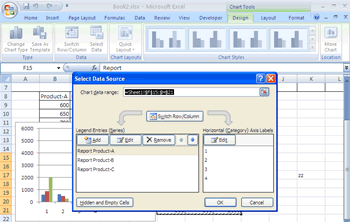
- Click anywhere on the chart that you want to modify.
- Choose Chart Tools Design => Data => Select Data Source. The Select Source Data dialog box opens with the current chart data selected in the worksheet.
- Click and drag in the worksheet to select the new data range. The Edit Data Source dialog box collapses so you can easily see your data.
- Release the mouse button. The Edit Data Source box reappears.
- Click ok. The Edit Data Source dialog box closes.
To quickly add or delete a series to a chart located on the same worksheet as the data, click anywhere on the chart that you want to edit. Notice that Excel surrounds the chart with selection handles and marks the source data in the worksheet with a colored border. Click and drag the corner handle of the worksheet source range to add or subtract cells.

No comments:
Post a Comment